A usual question that comes up is how one can translate the performance of a team in their national league to an international one. E.g., if AEK Athens had a net rating of +10 in the Greek league (wishful thinking these days but one can only dream), how does this translate to Euroleague? Having this translation can also allow us to translate player performance. There are various ranking lists that one can find online that are based on a variety of factors. For example, for domestic league rankings, TV revenues/ratings, fan attendance and facilities have been considered as inputs to the rankings from FIBA and later the Euroleague Basketball Company.
In this article, I will provide an optimization based approach to getting league ratings (and consequently rankings). The idea is simple: for teams that play in both domestic and international competition we calculate the difference in the net rating they post in each of the competitions they participated. Then we find league ratings that fit these differences as close as possible. For example, if AEK Athens had a net rating during the season of +5.4 in the Greek league and a net rating of +1.2 in the Basketball Champions League, then the difference in these ratings is 4.2, and we want to find ratings for the Greek league 


s.t. 
where 

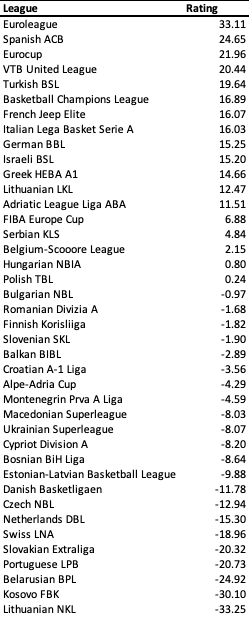
The way that you can interpret these ratings is as follows: with Euroleague having a rating of +33.11 and Greek HEBA A1 having a rating of +14.66, an average Euroleague team is better than an average Greek HEBA A1 team by 33.11-14.66 = 18.45 per 100 possessions.
Now one thing to consider is that league-“power” can change over the period of years, and these rankings should be recalculated. Also, and most importantly, teams (at least teams playing at high level of international competition) often treat domestic games differently – in terms of rotations etc. – and hence, they can underperform. However, overall I do not anticipate large differences at least in terms of ranking. Finally, the optimization problem can be slightly tuned to solve a weighted version of the objective functions, where the weight of each data point is a function of the number of games the team played in these leagues. For now, I have just considered cases where the team played at least 10 games in each league, but more sophisticated approaches are certainly better and will improve the ratings.

[…] a conference ranking similar to the UEFA ranking system (one possible way for such a ranking was described in this blog before). This can be based on random draws among teams of different conferences, with possible a yearly […]
LikeLike